Hello 👋. The software has never been more complex than it is today. Why? The monolithic is broken into microservices, distributed systems, heterogeneous tech stacks, cloud-native services, and so - to build resilient, powerful, efficient services and infrastructures. As the cloud adoption model grows, the need to monitor and observe the system is the precise requirement. In this blog post, let's see the overview of Observability, Open Telemetry, and the demo of integrating the Open Telemetry in .NET Core Apps.
Observability
Observability is proactive introspection of distributed systems for greater operational visibility, beyond monitoring. It's not just collecting the data - observability is about what data is important by looking at how the system actually behaves in production over time. Observability starts from the ad-hoc questions the developers/stakeholders asking for to observe the system from the outside.
Examples:
- Did our visit count increase?
- What's the average session time?
- Any changes in Key Performance Indicators?
- How do we know the calls between different microservices?
- CPU and/or memory usage?
- Tracing requests and errors?
- What logs should we look at right now?
- What changed? Why has performance degraded after the latest release?
- What did my service look like at a particular time point or time range?
- Performance Optimizations on the critical path?
The Observability can be defined in three foundation elements: Metrics, Logging, and Tracing.
Open Telemetry
There are a lot of challenges when it comes to observability. The vendor-specific locking and maintaining the specific vendor SDKs across the distributed systems are a nightmare. We need standards. That standard is OpenTelemetry - for telemetry as a Cloud Native Computing Foundation project since May 2019 with the merger of OpenCensus and OpenTracing projects.
OpenTelemetry is a vendor-neutral standard for collecting telemetry data for applications, their supporting infrastructures, and services. The Open Telemetry is used to instrument, generate, collect, and export telemetry data (metrics, logs, and traces) for analysis in order to understand your software's performance and behavior.
How does it work?
- API: Used to generate telemetry data. Follows Open Telemetry Specification
- SDK: Implementation of the API with processing and exporting capabilities.
- Data: Defines semantic conventions to provide vendor-agnostic implementations as well as the OpenTelemetry protocol (OTLP).
- Exporter: Exports the telemetry data and send it directly or through the collector to the telemetry backend.
- Collector: The vendor-specific or OTLP exporters are used for data filtering, aggregation, batching, and communication with various telemetry backends.
Open Telemetry in .NET Core Apps
In this demo, we will build .NET core apps containing interconnected microservices and trace the system using OpenTelemetry .NET.
What are we going to build?

- Order Service - The microservices that creates an order for the passed item code and quantity.
- Inventory Service - The microservices that verifies whether the requested quantity available in inventory and reduce the quantity when the inventory is claimed.
The Order service will call the Inventory service to verify and also claim the requested quantity for the order for the item code.
We have these two .NET core app running in docker containers. Now, let's add the OpenTelemetry .NET library in these projects and observe the trace in the Jaeger.
To run the Jaeger in local using Docker, please refer to this page or you can use the docker-compose file I've added in the demo repo referred below.
Install Nuget packages
- Install the OpenTelemetry .NET and OpenTelementry ASPNetCore Instrumentation libraries from NuGet packages.
dotnet add package OpenTelemetry.Instrumentation.AspNetCore
dotnet add package OpenTelemetry.Extensions.Hosting
- As we are calling the external HTTP services, we need to instrument the HttpClient libraries as well. Add the Http Instrumentation OpenTelemetry libraries.
dotnet add package OpenTelemetry.Instrumentation.Http
You can add other instrumentation open telemetry libraries also - such as Redis, SqlClient, GrpcClient, and other community contributed projects.
- Since we are going to use the Jaeger as our exporters, let's add the JaegerExporter
dotnet add package OpenTelemetry.Exporter.Jaeger
You can use the other exporters such as Prometheus, Zipkin, Console, OTLP, and other exporters that have OTLP standards.
Configure your .NET Core Application
ASP.NET Core instrumentation must be enabled at the application startup. Configure the OpenTelemetry Tracing in the ConfigureServices method using the ServiceCollection extension method provided by OpenTelemetry.Extensions.Hosting.
using Microsoft.Extensions.DependencyInjection;
using OpenTelemetry.Trace;

var resourceBuilder = ResourceBuilder.CreateDefault().AddService("OrderService");
services.AddOpenTelemetryTracing((builder) => builder
            .AddAspNetCoreInstrumentation()
            .AddHttpClientInstrumentation()
            .AddJaegerExporter()
            .SetResourceBuilder(resourceBuilder)
);
Jaeger
Now let's run the applications and launch the Jaeger locally. I've created the docker-compose file that runs all.
docker-compose up --build
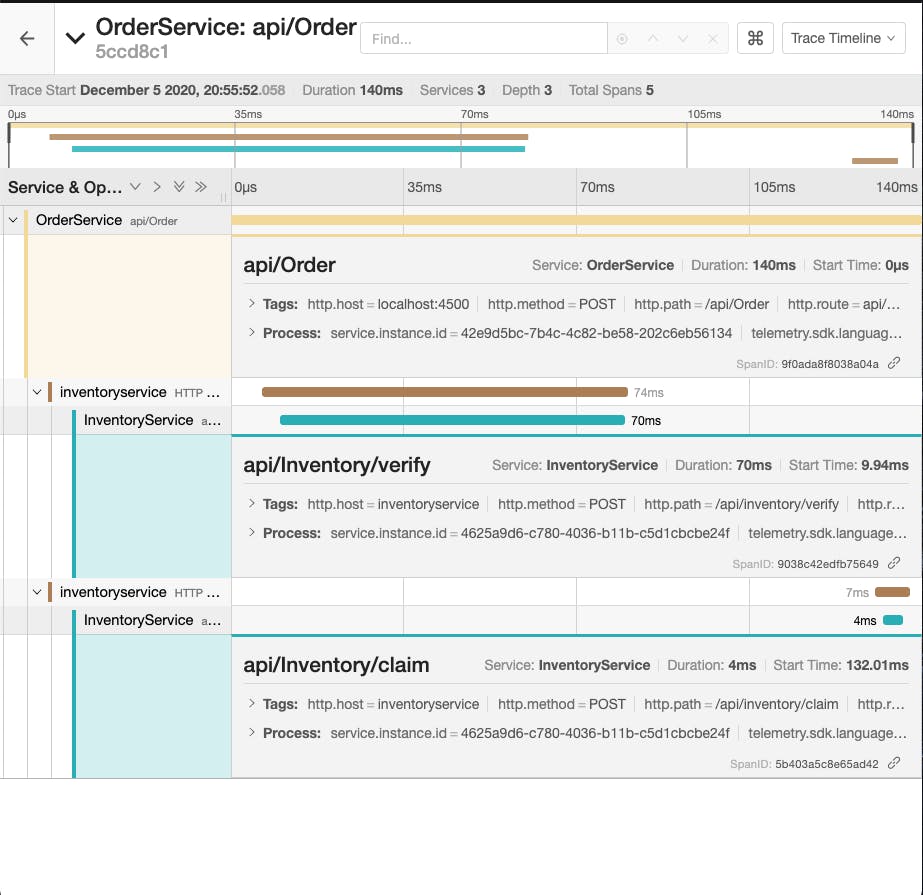
Now create an order using the Order Service. This Order service will verify the inventory, create an order, and claim the inventory to get processed.
curl --location --request POST 'http://localhost:4500/api/Order' \
--header 'Content-Type: application/json' \
--data-raw '{
    "itemCode": "PIZZA",
    "quantity": "1",
    "username": "Siva"
}'
Let's navigate to the Jaeger UI. See, how the traces are created and you can take a single trace and see what are the different spans, any external API calls, custom traces, and span.

Conclusion
Using OpenTelemetry SDK gives you more flexibility, offering integration with multiple monitoring backends.
You can explore and understand the APIs and concepts of it. Using in the production will take some time till the packages are in a stable state. OpenTelemetry’s .NET packages are in beta state and the APIs will be subject to change.
The OpenTelemetry efforts are promising and moving in the right direction for the observability - logs, metrics, and traces. The OpenTelemetry is majorly supporting traces now. The metrics are still in the early stage and .NET Core Metrics APIs are compatible with the OpenTelemetry Metrics API Specification. The logging is relying on Microsoft.Extensions.Logging for .NET libraries.
Checkout their repo for more details.
This post is created as part of the C# Advent Calendar 2020 Please check out the link to find other great articles posted in the series.
Please follow me on my twitter, linkedin and github for more articles/demos on cloud native, containers and mobile/web apps.

