Observability is an essential part of any cloud-native environment. When it comes to Amazon EKS clusters, observability is an even more critical factor. This blog post will explore how you can provision an observability landscape to monitor and manage your EKS clusters using AWS Observability Accelerator for Terraform.
The AWS Observability accelerator for Terraform is a powerful terraform module that enables developers to quickly and easily set up observability solutions for their Amazon Elastic Container Service for Kubernetes (EKS) clusters using Amazon Web Services (AWS) observability services. This tool includes a core module that helps you configure your cluster with the AWS Distro for OpenTelemetry (ADOT) Operator for EKS, Amazon Managed Service for Prometheus, and Amazon Managed Grafana.
In addition to the core module, the AWS Observability accelerator also includes a set of workload modules that provide curated ADOT collector configurations, Grafana dashboards, Prometheus recording rules, and alerts. These modules allow you to leverage the power of these tools to monitor and troubleshoot your applications and infrastructure in real-time.
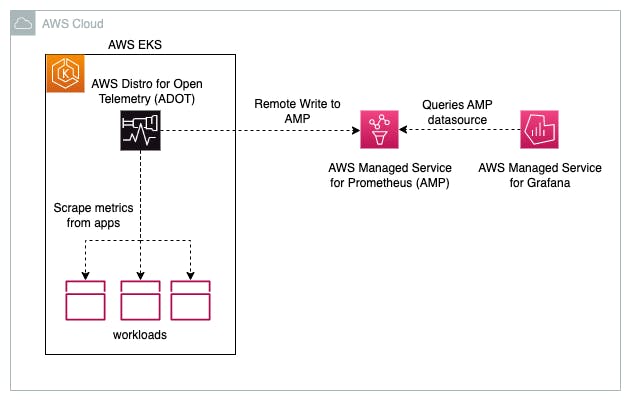
In this post, we will set up the EKS cluster using terraform. Then we will provision AWS Managed service for Prometheus, AWS Managed service for Grafana, Install AWS Distro for Open Telemetry in Cluster to scrape the metrics and necessary recording rules, and dashboards for Prometheus and Grafana - all these in only a few lines of Infrastructure as Code.
Let’s start with the setup of initializing the EKS cluster using the EKS Blueprints terraform module.
Initialize the EKS cluster using the EKS Blueprints terraform module. EKS blueprints are modular constructs available in CDK and as terraform modules that can provision fully functional production-ready kubernetes cluster and modular add-ons such as service mesh, autoscalers, networking, storage, gitops, etc.
 module "eks_blueprints" {
   source          = "github.com/aws-ia/terraform-aws-eks-blueprints?ref=v4.19.0"
   cluster_name    = var.cluster_name
   cluster_version = "1.20"

   vpc_id             = var.vpc_id
   private_subnet_ids = var.private_subnet_ids
   public_subnet_ids  = var.public_subnet_ids

   managed_node_groups = {
     t3_small = {
       node_group_name = "node-group-t3-small"
       instance_types  = ["t3.small"]
       subnet_ids      = var.private_subnet_ids
       min_size        = 1
       max_size        = 2
       desired_size    = 1
     }
   }

   tags = var.tags
 }
You can then specify which observability services you want to enable, such as the ADOT operator, Amazon Managed Prometheus, and Amazon Managed Grafana.
 module "eks_observability_accelerator" {
   source = "github.com/aws-observability/terraform-aws-observability-accelerator?ref=v1.5.0"

   aws_region     = var.aws_region
   eks_cluster_id = module.eks_blueprints.eks_cluster_id

     enable_amazon_eks_adot    = true
   enable_managed_prometheus = true
   enable_alertmanager       = true
     enable_managed_grafana    = true

   tags = var.tags
 }
You can also specify your own instance IDs if you want to reuse existing managed services or disable the creation of managed services altogether.
 module "eks_observability_accelerator" {
   source = "github.com/aws-observability/terraform-aws-observability-accelerator?ref=v1.5.0"

   aws_region     = var.aws_region
   eks_cluster_id = module.eks_blueprints.eks_cluster_id

     enable_amazon_eks_adot    = true
   enable_managed_prometheus = true
   enable_alertmanager       = true

     # Reuse existing setup by disabling the creation of managed grafana service
     # and pass the existing service workspace id
   enable_managed_grafana       = false
   managed_grafana_workspace_id = var.managed_grafana_workspace_id
   grafana_api_key              = var.grafana_api_key

   tags = var.tags
 }
Set up the default Grafana dashboards, alerting rules, and metrics scraping configuration from AWS Observability Accelerator for Terraform modules. You can customize them as needed.
 module "workloads_infra" {
   source = "github.com/aws-observability/terraform-aws-observability-accelerator/modules/workloads/infra"

   eks_cluster_id = module.eks_observability_accelerator.eks_cluster_id

   dashboards_folder_id            = module.eks_observability_accelerator.grafana_dashboards_folder_id
   managed_prometheus_workspace_id = module.eks_observability_accelerator.managed_prometheus_workspace_id

   managed_prometheus_workspace_endpoint = module.eks_observability_accelerator.managed_prometheus_workspace_endpoint
   managed_prometheus_workspace_region   = module.eks_observability_accelerator.managed_prometheus_workspace_region

   # optional, defaults to 60s interval and 15s timeout
   prometheus_config = {
     global_scrape_interval = "60s"
     global_scrape_timeout  = "15s"
   }

   depends_on = [
     module.eks_observability_accelerator
   ]
 }
Once you have included the AWS Observability Accelerator in your Terraform configuration and specified which services you want to enable, you can use Terraform to provision the observability landscape for your EKS cluster.
 terraform plan -var-file env/dev.tfvars
 terraform apply -var-file env/dev.tfvars
The complete Observability Landscape has been set up for you - including ADOT (AWS Distro for Open Telemetry collectors), AWS Managed Services for Prometheus (Prometheus endpoints where ADOT writes the metrics), AWS Managed Services for Grafana (where it can query from Prometheus data sources to build dashboards and display alerts).
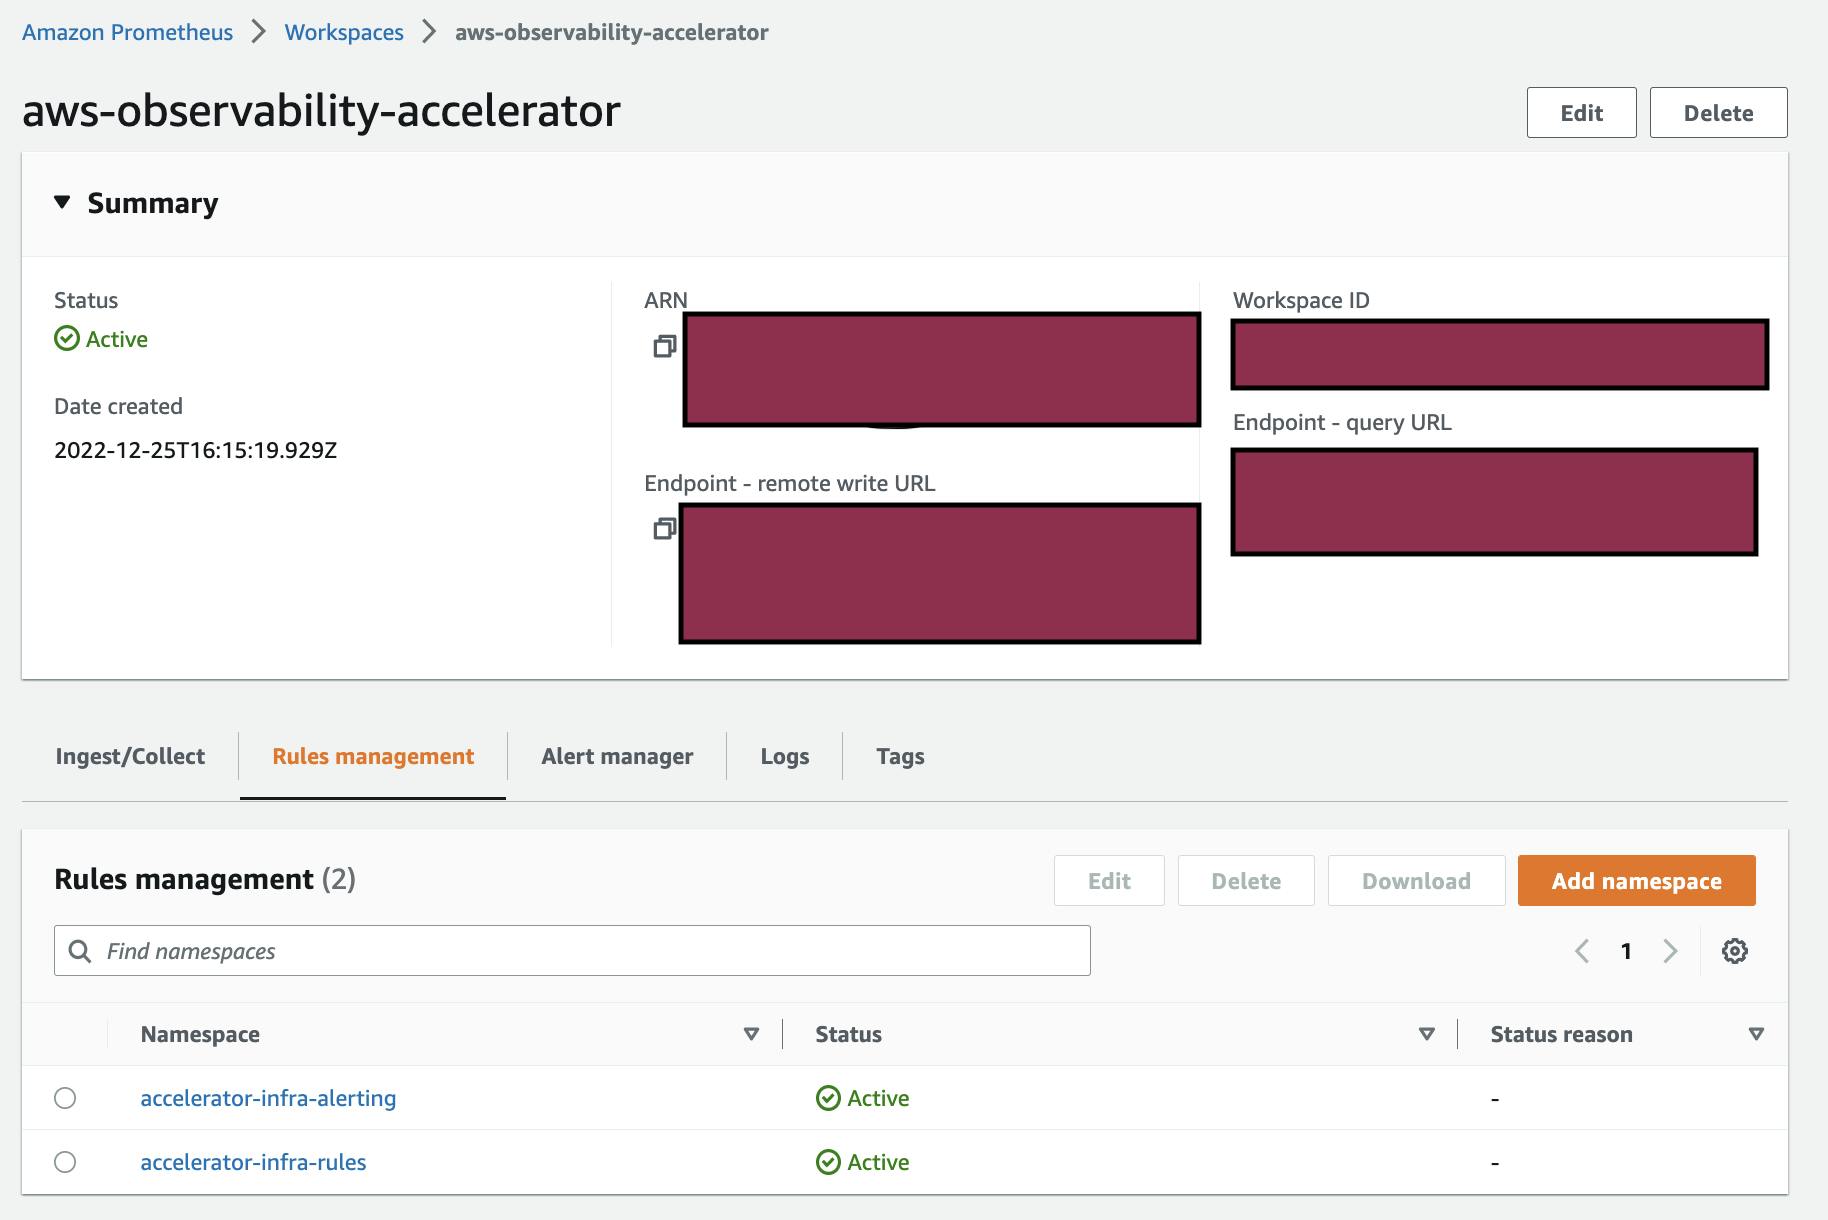
You can view the Prometheus Endpoint URL, alerting, and recording rules in the AWS console.
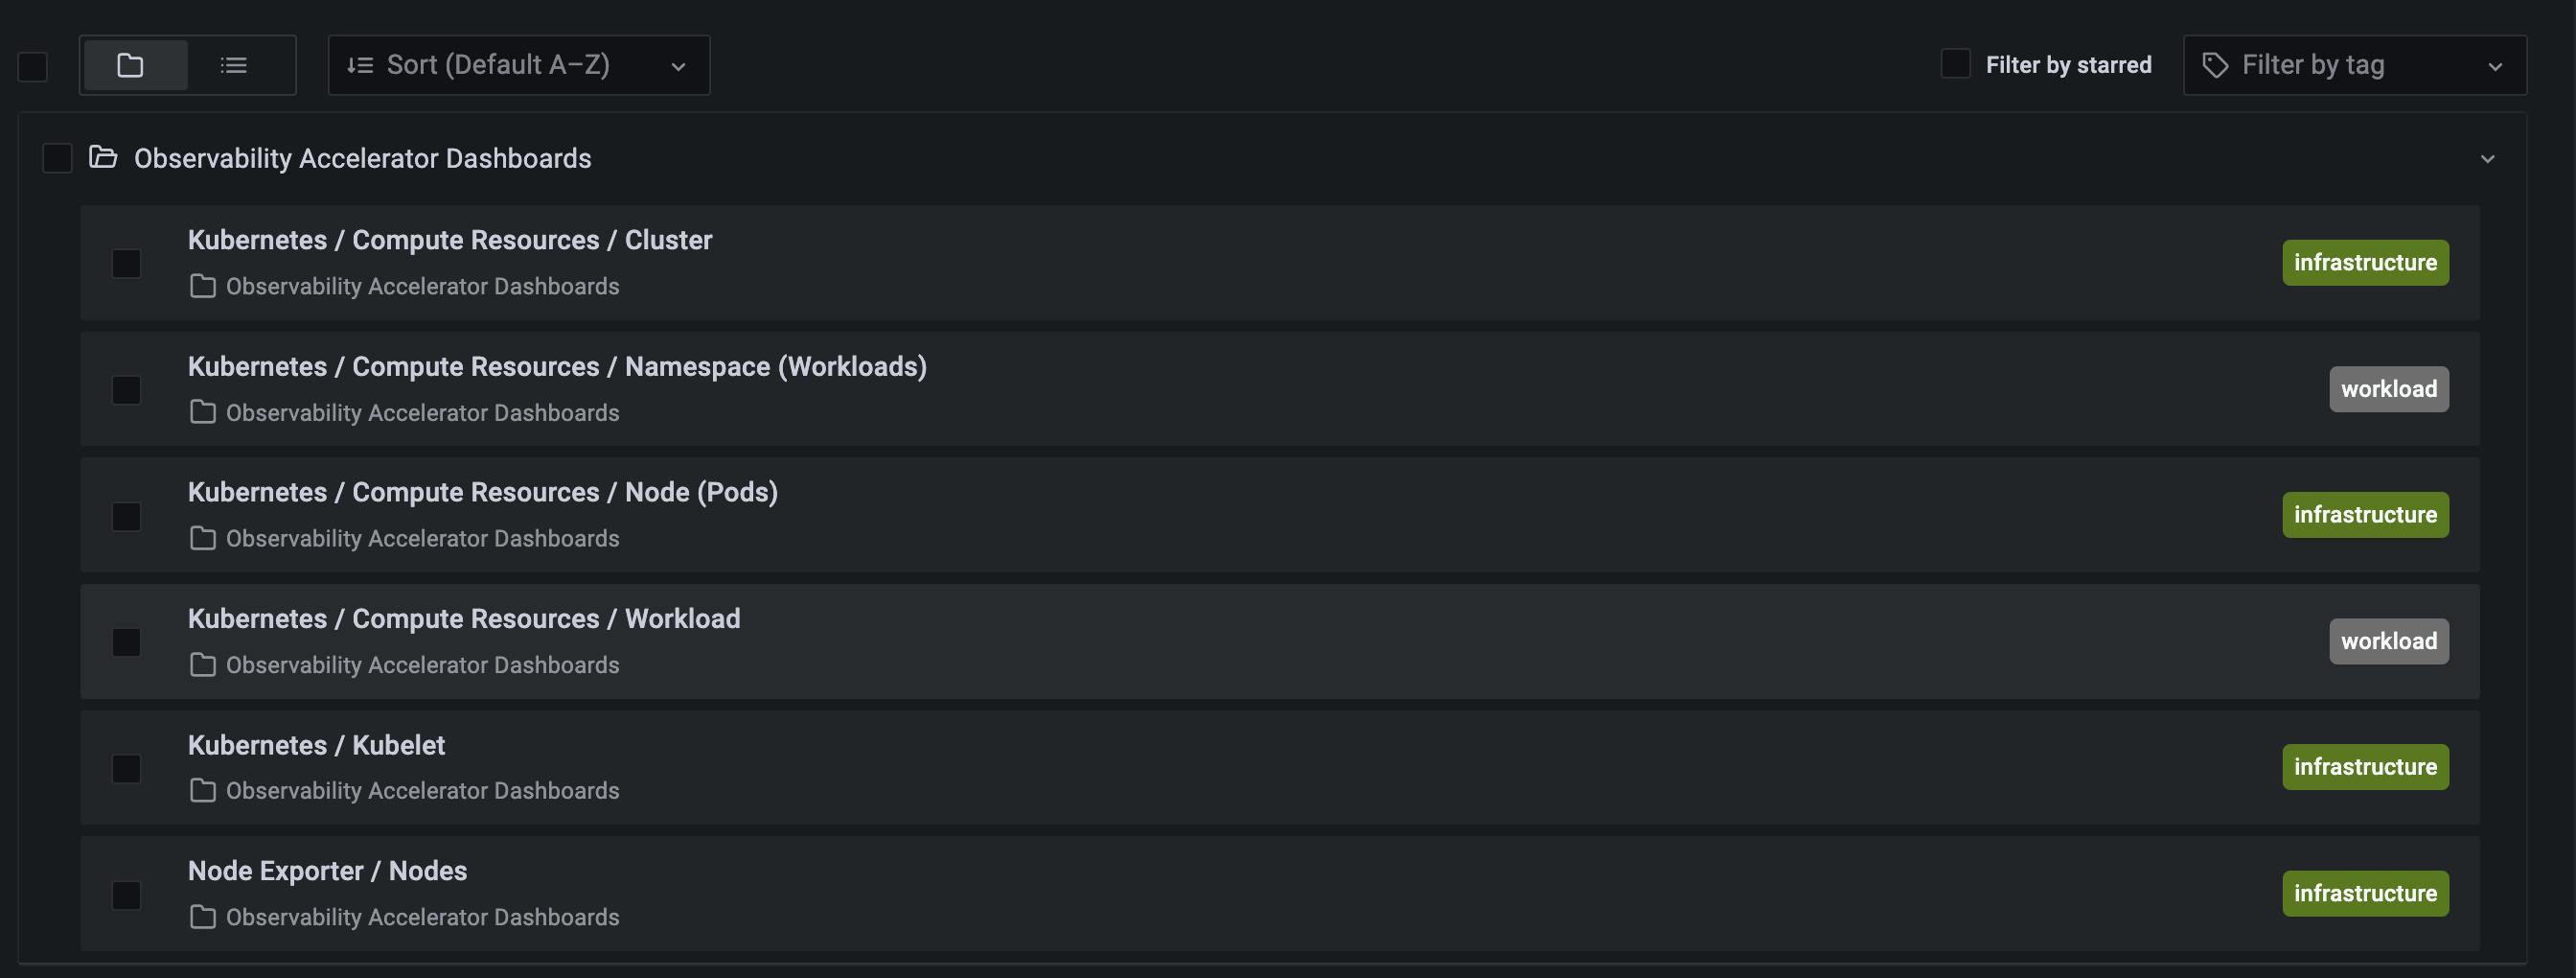
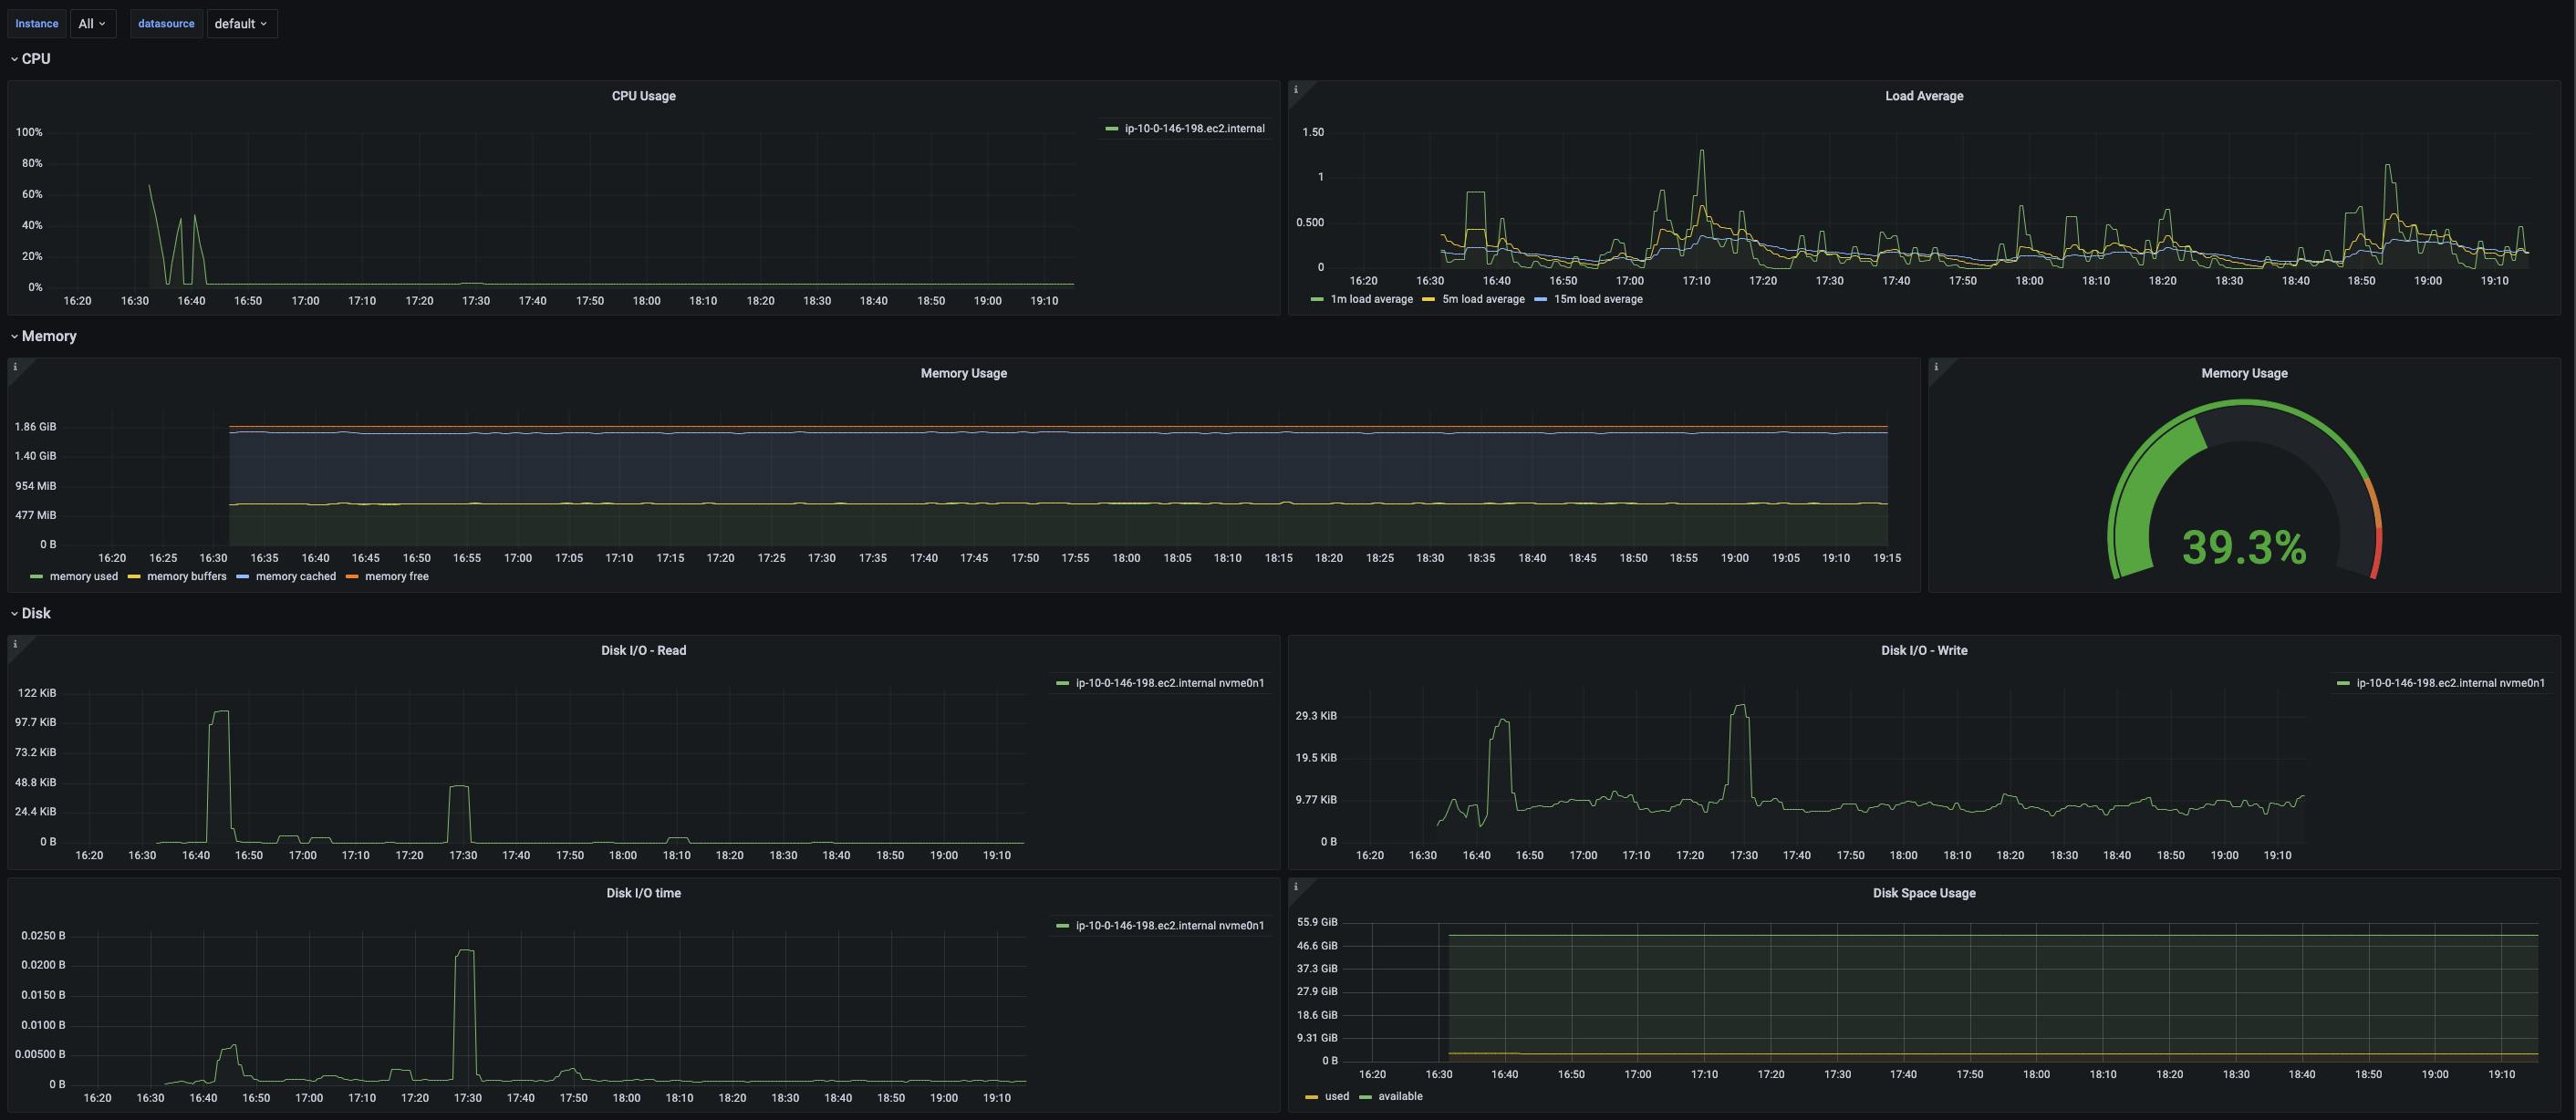
Navigate the Grafana Dashboard in the AWS Managed Services for the Grafana workspace, and configure the user to view/edit the dashboards. The necessary dashboards are already created for the user to view.
Kubernetes - Cluster
Kubernetes - Namespace(Workloads)
Kubernetes - Node (Pods)
Kubernetes - Workload
Kubernetes - Kubelet
Node Exporter - Nodes
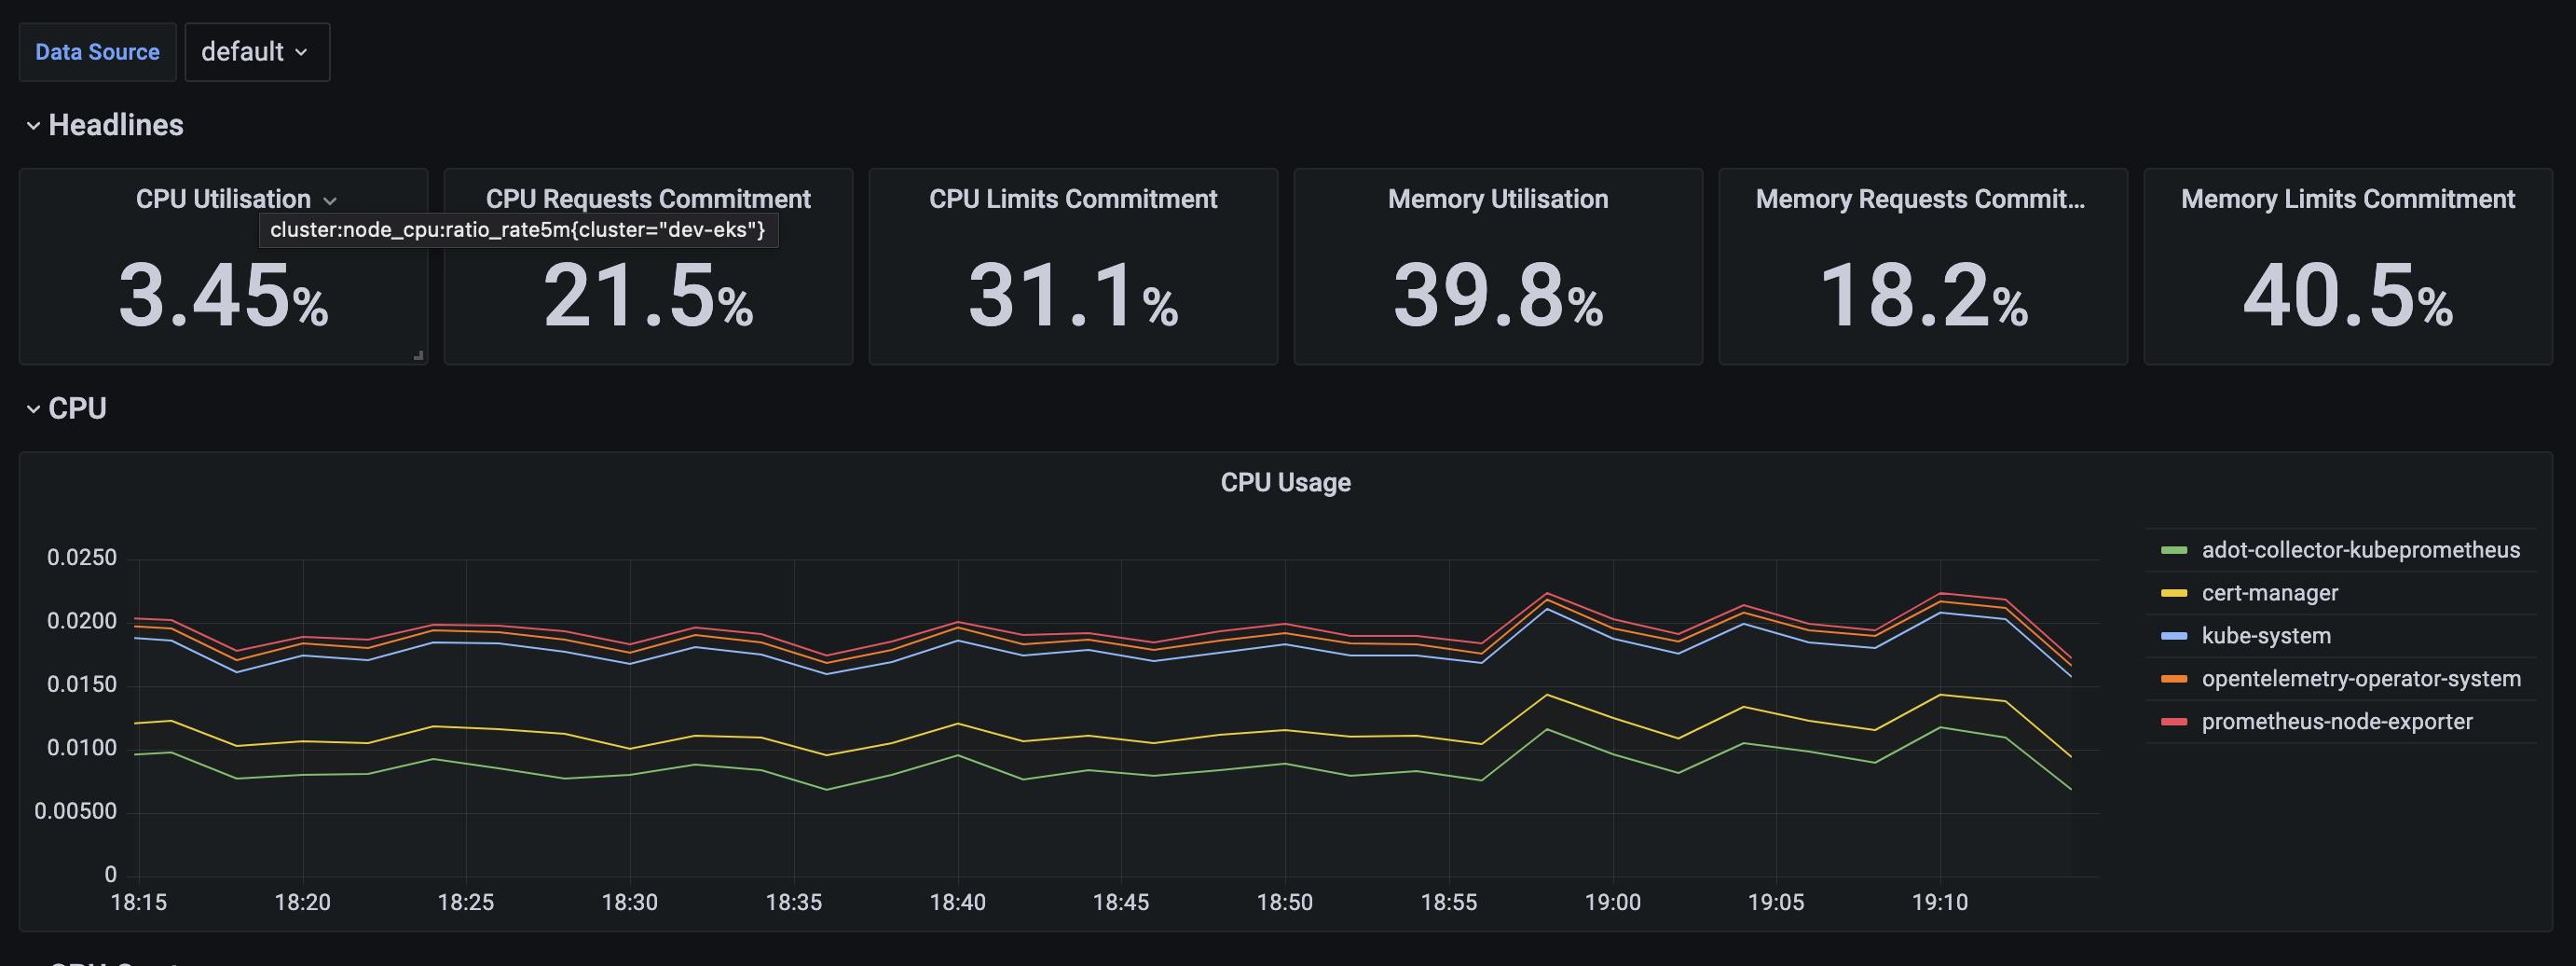
You can navigate to the individual dashboard and view the charts based on the metrics scraped from the infrastructure and workloads.
Conclusion
In conclusion, the AWS Observability Accelerator for Terraform is a powerful terraform module that allows you to quickly and easily set up observability solutions for your EKS clusters. It includes a core module and a set of workload modules that provide curated configurations, dashboards, recording rules, and alerts to help you monitor and troubleshoot your applications and infrastructure in real-time. Using the AWS Observability Accelerator, you can leverage the power of tools like Prometheus and Grafana to visualize and analyze your metrics and logs, enabling you to optimize and improve the performance and reliability of your cloud-native environments.
I'm Siva - working as Director, DevOps & Principal Architect at Computer Enterprises Inc from Orlando. I'm an AWS Community builder. I will write a lot about Cloud, Containers, IoT, and DevOps. If you are interested, please follow me @ksivamuthu on Twitter or check out my blogs at sivamuthukumar.com


